Monday, January 18, 2016

Milwaukee Metro Area Segregation


(Image from UW-Milw CED report, The Economic State of Milwaukee, 1990-2008)


Included here are some graphics detailing the persistent black-white segregation that exists in the Milwaukee metro area. This information has been compiled in connection with the post "Silent Reflection for Each of the Victims of Violence Within an American City." Several things to note in what follows:
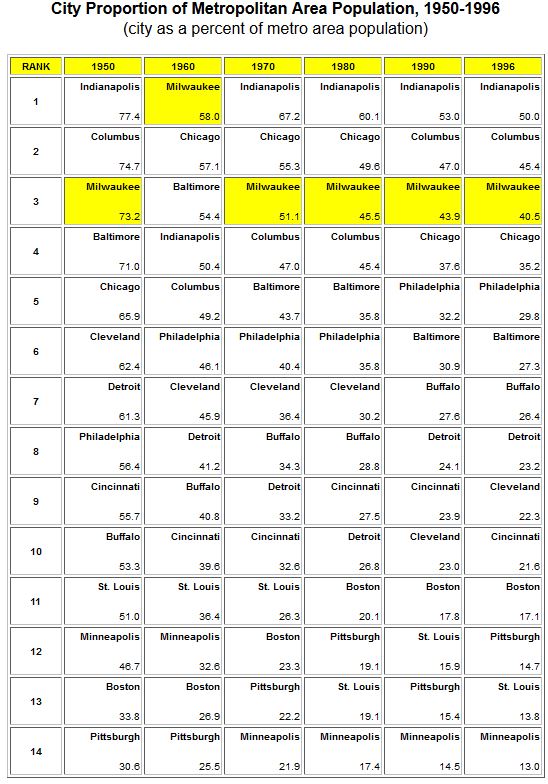
1) By any measure, the Milwaukee metro area is one of the most racially segregated places in the country.
2) Milwaukee's segregation ranking against other metro areas has increased over recent decades (1980-2010).
3) Among the most segregated metro areas in the country, Milwaukee leads, by far, in its lack of "suburbanization" of its minority population.
4) National averages for black-white segregation peaked around 1965, and have since seen a steady decline.
5) For a graphical explanation of segregation measurement methodology see images from the 2000 U.S. Census Bureau report presented below.
6) For a discussion of Milwaukee's segregated housing environment see the historic timeline (1896-2004) presented in the 2005 report below.
7) See post Milwaukee Area Population - Changes and Characteristics for additional comments.


The following image is taken from the City of Milwaukee, July, 2014, draft report, Growing Prosperity, An action agenda for economic development in the city of Milwaukee (http://media.jrn.com/documents/growing-prosperity-draft-7-2-14.pdf):


The following 2 tables are taken from the U of MI Population Studies Center (PSC) Institute for Social Research, New Racial Segregation Measures for Large Metropolitan Areas: Analysis of the 1990-2010 Decennial Censuses, which is based on the work of William Frey, Brookings Institution and Univ. of MI Social Science Data Analysis Network's analysis of 1990, 2000, and 2010 Census Decennial Census tract data (http://www.psc.isr.umich.edu/dis/census/segregation2010.html). Data for 2010 is also displayed at a companion site, Census Scope 2010 (http://censusscope.org/2010Census/).

Note (copied verbatim from PSC site):
Segregation Indices are Dissimilarity Indices (D) that measure the degree to which the minority group is distributed differently than whites aross census tracts. They range from 0 (complete integration) to 100 (complete segregation) where the value indicates the percentage of the minority group that needs to move to be distributed exactly like whites.

Note: In this analysis all racial groups (whites, blacks, asians and other races) are non-Hispanic (NH) members of those races. Hispanics are shown as a separate category.
(Milwaukee ranking, D: 1-2010, 2-2000, 3-1990)


(Milwaukee ranking, D: 9-2010, 10-2000, 14-1990)


The following 4 images are taken from a July, 2013, report by the UW-Milwaukee Center for Economic Development, titled, Perspectives on the Current State of the Milwaukee Economy (http://www4.uwm.edu/ced/publications/perspectives.pdf):


(NH - non-Hispanic)


The following 7 images are taken from a March, 2011, report for Project US 2010, titled, The Persistence of Segregation in the Metropolis: New Findings from the 2010 Census, by John R. Logan (Brown Univ.) and Brian Stults (FL State Univ.) (http://www.s4.brown.edu/us2010/Data/Report/report2.pdf). Slightly different units of analysis are used here in this report, resulting in numbers (D) that vary slightly from those that are presented above by Frey:
(Note: Milwaukee rankings identical to Frey findings above, however D values presented are slightly different)


(Milwaukee ranking, I: 5-2010, 9-2000, 8-1990, 14-1980)


(Data for U.S. average Dissimilarity, and Isolation (given in neighborhood breakdown))


(U.S. metro average; note that "exposure" = Isolation Index)


(Average neighborhood composition for each ethnic group, showing Isolation numbers from summary table above)


The following 10 images are taken from chapters 2 & 5 of the U.S. Census Bureau Report, Racial and Ethnic Residential Segregation in the United States: 1980-2000 (https://www.census.gov/hhes/www/housing/housing_patterns/pdftoc.html). Slightly different units of analysis are used here in this report, resulting in numbers (D) that vary slightly from those that are presented above by Frey. Residential segregation measurement methodology is also explained:


(See Table 2-1 below for Index names)


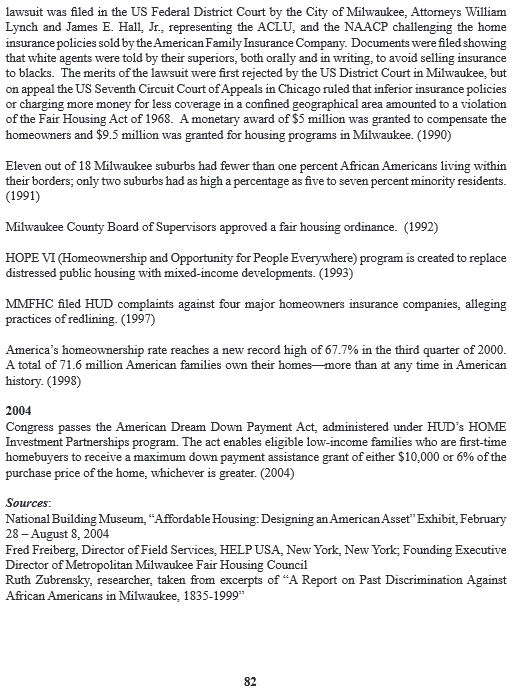
The following 12 images are of a timeline (1896-2004) outlining both local and national housing policies and practices impacting the Milwaukee metro area, and is taken from the appendix of an August, 2005, report by the Metropolitan Milwaukee Fair Housing Council, titled City of Milwaukee, Impediments to Fair Housing (http://www.ci.mil.wi.us/ImageLibrary/User/jsteve/MilwaukeeAI.pdf):


Tuesday, January 5, 2016

Milwaukee Area Population - Changes and Characteristics

The following is a cursory review of published data on Milwaukee's population, focusing on four issues: metro area change (growth and migration); density; age and ethnicity; household characteristics. This information has been compiled in connection with the post "Silent Reflection for Each of the Victims of Violence Within an American City."

A couple of points worth noting:
1) City of Milwaukee population peaks in 1960 at around 741,000. Currently it's at 599,642 (2014).
2) Beginning around 1960, suburban population grows rapidly (coinciding with the growth of the freeway system).
3) Ethnicity of the City of Milwaukee goes from over 71% white in 1980 to 37% by 2010. Percentage was likely much higher prior to 1980.
4) African American population of the City of Milwaukee increases from 23% in 1980 to 40% by 2010.
5) Metro area African American population is highly concentrated in the City of Milwaukee, and within the City it is also concentrated within the northwest side (to be discussed later in more detail).
6) Racial composition of working-age male population has gone from 86% white in 1970 to 48% white by 2005.
7) Youth population (under 15) of  metro area is around 45% minority in 2010.
8) Youth population (under 15) of City of Milwaukee is 83% minority in 2010.

Taken from (http://www4.uwm.edu/ced/publications/milwecon_2010.pdf).


-Metro Area Change

The following table has been drawn from the 2015 Milwaukee Journal-Sentinel online database (source: U.S. Census Bureau) (http://www.jsonline.com/watchdog/dataondemand/population-estimates-for-wisconsin-cities-towns-and-villages-2014-304507351.html#!/popestimate2014.desc.1/):


The following is taken from a May, 2014, story in Urban Milwaukee (http://urbanmilwaukee.com/2014/05/07/milwaukee-is-a-great-lakes-star/):


The following 4 images are taken from a 2010 report by the UW-Milwaukee Center for Economic Development, titled The Economic State of Milwaukee, 1990-2008 (http://www4.uwm.edu/ced/publications/milwecon_2010.pdf):


The following 2 images are taken from the 2000, City of Milwaukee Urban Atlas (no longer available online):


The following 4 images are taken from a 1998 report from the UW-Milwaukee Center for Economic Development, titled The Economic State of Milwaukee: The City and the Region (https://www4.uwm.edu/ced/publications/milwecon/about.cfm):


-Density

The following image is taken from the online City of Milwaukee "Map Milwaukee Portal, Census 2010" (http://city.milwaukee.gov/mapmilwaukee#.VW3MHkbQOh4):
Population Density


-Age and Ethnicity

The following image is taken from the City of Milwaukee, July, 2014, draft report, Growing Prosperity, An action agenda for economic development in the city of Milwaukee (http://media.jrn.com/documents/growing-prosperity-draft-7-2-14.pdf):


The following image is taken from a 2013 report by the UW-Milwaukee Center for Economic Development, titled Perspectives on the Current State of the Milwaukee Economy (http://www4.uwm.edu/ced/publications/perspectives.pdf):


The following image is taken from a 2012 working paper by the UW-Milwaukee Center for Economic Development, titled Race and Male Employment in the Wake of the Great Recession: Black Male Employment Rates in Milwaukee And the Nation’s Largest Metro Areas 2010
(http://www4.uwm.edu/ced/publications/black-employment_2012.pdf):


The following 3 images are taken from the UW-Milwaukee Employment & Training Institute, "Monthly Drilldowns for the Milwaukee Area Workforce Investment Board", 2010-2011 (https://www4.uwm.edu/eti/reports/indypage.htm):
August, 2011

August, 2011

July, 2010


The following 3 images are taken from the online City of Milwaukee "Map Milwaukee Portal, Census 2010" (http://city.milwaukee.gov/mapmilwaukee#.VW3MHkbQOh4):
Percent Minority

Percent Hispanic

Median Age


The following image is taken from the City of Milwaukee's, March, 2010, report, Citywide Policy Plan, Chap. 10 (http://city.milwaukee.gov/Plansandstudies/CitywidePolicyPlan.htm#.VVITE5PQOLU):
(Note: This chart seems to be in error for the 2008 white population. Based on U.S. Census quick facts (http://quickfacts.census.gov/qfd/states/55/5553000.html), the 2010 white population is 594,833 x 37% = 220,088. Also, see figures above.)


The following 5 images are taken from a 2010 report by the UW-Milwaukee Center for Economic Development, titled The Economic State of Milwaukee, 1990-2008 (http://www4.uwm.edu/ced/publications/milwecon_2010.pdf):


(Note outlying cluster in southern Milw. Co. corresponding to House of Correction locality)


The following 4 images are taken from a March, 2007 report by the UW-Milwaukee Center for Economic Development, titled The Crisis of Black Male Joblessness in Milwaukee (https://www4.uwm.edu/ced/publications/blackcrisis307.pdf). Working-age defined as ages 16-64:


The following 2 images are taken from the City of Milwaukee's, March, 2010, report, Citywide Policy Plan, Chap. 10, (using 2000 Census data), (http://city.milwaukee.gov/Plansandstudies/CitywidePolicyPlan.htm#.VVITE5PQOLU):


The following 5 images are taken from an August, 2005, report by the Metropolitan Milwaukee Fair Housing Council, titled City of Milwaukee, Impediments to Fair Housing (http://www.ci.mil.wi.us/ImageLibrary/User/jsteve/MilwaukeeAI.pdf):


(Note outlying cluster in southern Milw. Co. corresponding to House of Correction locality)


The following 5 images are taken from the 2000, City of Milwaukee Urban Atlas (no longer available online):


Percent born in southern state

Percent foreign born


-Household Characteristics

The following image is taken from the online City of Milwaukee "Map Milwaukee Portal, Census 2010" (http://city.milwaukee.gov/mapmilwaukee#.VW3MHkbQOh4):
Household size


The following 4 images are taken from the 2000, City of Milwaukee Urban Atlas (no longer available online):
(MC - married couple, MF - male-headed family, FF - female-headed family)

Average household size

Households headed by females

Households with 2+ people but not a family