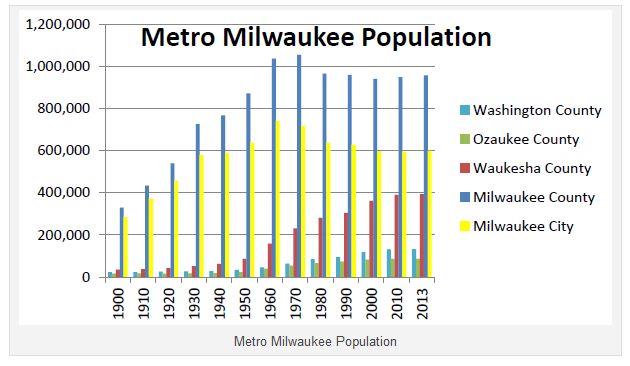
A couple of points worth noting:
1) City of Milwaukee population peaks in 1960 at around 741,000. Currently it's at 599,642 (2014).
2) Beginning around 1960, suburban population grows rapidly (coinciding with the growth of the freeway system).
3) Ethnicity of the City of Milwaukee goes from over 71% white in 1980 to 37% by 2010. Percentage was likely much higher prior to 1980.
4) African American population of the City of Milwaukee increases from 23% in 1980 to 40% by 2010.
5) Metro area African American population is highly concentrated in the City of Milwaukee, and within the City it is also concentrated within the northwest side (to be discussed later in more detail).
6) Racial composition of working-age male population has gone from 86% white in 1970 to 48% white by 2005.
7) Youth population (under 15) of metro area is around 45% minority in 2010.
8) Youth population (under 15) of City of Milwaukee is 83% minority in 2010.
Taken from (http://www4.uwm.edu/ced/publications/milwecon_2010.pdf).
-Metro Area Change
The following table has been drawn from the 2015 Milwaukee Journal-Sentinel online database (source: U.S. Census Bureau) (http://www.jsonline.com/watchdog/dataondemand/population-estimates-for-wisconsin-cities-towns-and-villages-2014-304507351.html#!/popestimate2014.desc.1/):
The following is taken from a May, 2014, story in Urban Milwaukee (http://urbanmilwaukee.com/2014/05/07/milwaukee-is-a-great-lakes-star/):
The following 4 images are taken from a 2010 report by the UW-Milwaukee Center for Economic Development, titled The Economic State of Milwaukee, 1990-2008 (http://www4.uwm.edu/ced/publications/milwecon_2010.pdf):
-Density
The following image is taken from the online City of Milwaukee "Map Milwaukee Portal, Census 2010" (http://city.milwaukee.gov/mapmilwaukee#.VW3MHkbQOh4):
 |
| Population Density |
-Age and Ethnicity
The following image is taken from the City of Milwaukee, July, 2014, draft report, Growing Prosperity, An action agenda for economic development in the city of Milwaukee (http://media.jrn.com/documents/growing-prosperity-draft-7-2-14.pdf):
The following image is taken from a 2013 report by the UW-Milwaukee Center for Economic Development, titled Perspectives on the Current State of the Milwaukee Economy (http://www4.uwm.edu/ced/publications/perspectives.pdf):
The following image is taken from a 2012 working paper by the UW-Milwaukee Center for Economic Development, titled Race and Male Employment in the Wake of the Great Recession: Black Male Employment Rates in Milwaukee And the Nation’s Largest Metro Areas 2010
(http://www4.uwm.edu/ced/publications/black-employment_2012.pdf):
The following 3 images are taken from the UW-Milwaukee Employment & Training Institute, "Monthly Drilldowns for the Milwaukee Area Workforce Investment Board", 2010-2011 (https://www4.uwm.edu/eti/reports/indypage.htm):
 |
| August, 2011 |
 |
| August, 2011 |
 |
| July, 2010 |
The following 3 images are taken from the online City of Milwaukee "Map Milwaukee Portal, Census 2010" (http://city.milwaukee.gov/mapmilwaukee#.VW3MHkbQOh4):
 |
| Percent Minority |
 |
| Percent Hispanic |
 |
| Median Age |
The following image is taken from the City of Milwaukee's, March, 2010, report, Citywide Policy Plan, Chap. 10 (http://city.milwaukee.gov/Plansandstudies/CitywidePolicyPlan.htm#.VVITE5PQOLU):
(Note: This chart seems to be in error for the 2008 white population. Based on U.S. Census quick facts (http://quickfacts.census.gov/qfd/states/55/5553000.html), the 2010 white population is 594,833 x 37% = 220,088. Also, see figures above.)
The following 5 images are taken from a 2010 report by the UW-Milwaukee Center for Economic Development, titled The Economic State of Milwaukee, 1990-2008 (http://www4.uwm.edu/ced/publications/milwecon_2010.pdf):
 |
| (Note outlying cluster in southern Milw. Co. corresponding to House of Correction locality) |
The following 4 images are taken from a March, 2007 report by the UW-Milwaukee Center for Economic Development, titled The Crisis of Black Male Joblessness in Milwaukee (https://www4.uwm.edu/ced/publications/blackcrisis307.pdf). Working-age defined as ages 16-64:
The following 2 images are taken from the City of Milwaukee's, March, 2010, report, Citywide Policy Plan, Chap. 10, (using 2000 Census data), (http://city.milwaukee.gov/Plansandstudies/CitywidePolicyPlan.htm#.VVITE5PQOLU):
The following 5 images are taken from an August, 2005, report by the Metropolitan Milwaukee Fair Housing Council, titled City of Milwaukee, Impediments to Fair Housing (http://www.ci.mil.wi.us/ImageLibrary/User/jsteve/MilwaukeeAI.pdf):
 |
| (Note outlying cluster in southern Milw. Co. corresponding to House of Correction locality) |
The following 5 images are taken from the 2000, City of Milwaukee Urban Atlas (no longer available online):
 |
| Percent born in southern state |
 |
| Percent foreign born |
-Household Characteristics
The following image is taken from the online City of Milwaukee "Map Milwaukee Portal, Census 2010" (http://city.milwaukee.gov/mapmilwaukee#.VW3MHkbQOh4):
 |
| Household size |
The following 4 images are taken from the 2000, City of Milwaukee Urban Atlas (no longer available online):
 |
| (MC - married couple, MF - male-headed family, FF - female-headed family) |
 |
| Average household size |
 |
| Households headed by females |
 |
| Households with 2+ people but not a family |


No comments:
Post a Comment