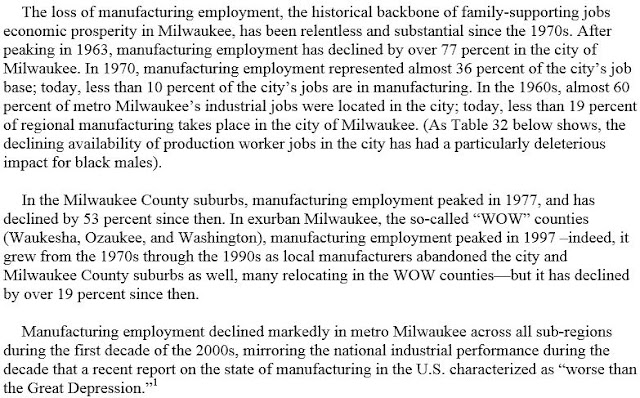
Here are some basic plot points on how the loss of manufacturing jobs, and decentralization of job growth, has affected the city of Milwaukee and the region:
1) Beginning in the 1960s, Milwaukee, along with other Frostbelt cities, shed tens of thousands of well-paying manufacturing jobs.
2) Manufacturing employment, only a subset of the city's total jobs, has shifted from 36% of the city's job base in 1970 to less than 10% today. (Specifics on other job sectors may be discussed later.)
3) Large numbers of new, along with relocated, manufacturing jobs begin to appear in the suburbs around 1970, peaking in 1997.
4) Loss of manufacturing jobs hit African American workers the hardest, as they live primarily in the City of Milwaukee.
5) New jobs (1994-2009), when they do appear, are located primarily in suburbs and WOW counties (Washington, Ozaukee, Waukesha).
6) In 2011 less than 17% of City of Milwaukee workers find employment in WOW counties.
7) This has led to a regional segmentation of the metro area labor market.
8) Lack of a robust regional public transportation system has created an unnecessary hurdle to employment for inner city residents (possibly more on this later).
9) Employment/unemployment figures, which are only briefly touched upon here in the text, begin to diverge widely between the City of Milwaukee and the surrounding WOW counties, especially regarding African American males (possibly more on this later).
 |
| (Ref. UW-Milw CED report, The Economic State of Milwaukee, 1990-2008) |
The following 10 images are taken from a July, 2013, report by the UW-Milwaukee Center for Economic Development, titled, Perspectives on the Current State of the Milwaukee Economy (http://www4.uwm.edu/ced/publications/perspectives.pdf):
 |
| (Note on above text: Narrative remains unchanged, however, some percentages are slightly altered using updated numbers below; For Table 32 ref. see 2012 report immediately following.) |
Table 6, Manufacturing Jobs (this table supersedes version shown in report):
 |
| (Source: U.S. Bureau of Census, Economic Census; LEHD. MSA - Metro statistical area.) |
>
>
 |
| (Total of all metro area workers, 714,838, and where they work by race) |
 |
| (Total of all metro area workers and where they work; Compare with Table 20 below from 2007 report) |
 |
| (Percentage of residents from some neighboring municipalities that work in Milwaukee, incl. Milw.; Mequon in Ozaukee, Germantown in Washington, Brookfield in Waukesha, all else in Milw. County) |
 |
| (Broken down for where residents of each city/county work. Largest share within each row is highlighted.) |
The following image is taken from a 2012 report by the UW-Milwaukee Center for Economic Development, titled, Race and Male Employment in the Wake of the Great Recession: Black Male Employment Rates in Milwaukee And the Nation’s Largest Metro Areas (http://www4.uwm.edu/ced/publications/black-employment_2012.pdf):
 |
| (Numbers are for the more general "Manufacturing" label, within metro area) |
The following 11 images are taken from a March, 2007, report by the UW-Milwaukee Center for Economic Development, titled, The Crisis of Black Male Joblessness in Milwaukee (https://www4.uwm.edu/ced/publications/blackcrisis307.pdf). These figures may seem somewhat outdated, however, since 2007 there's been the Great Recession, with only a nominal recovery thereafter, so although the report is eight years old it is likely still very relevant:
 |
| (above percentages refer specifically to City of Milwaukee, as opposed to the metro area) |
>
>
>
 |
| (For percentages noted here, refer also to Table 10 above from 2013 report for more recent figures) |
>
>
 |
| (See Table 6 from 2013 report above for latest deindustrialization figures) |
 |
| (Compare with Table 11 above from 2013 report) |
 |
| (Compare to 2010 data shown in Table 10 of 2013 report above) |
The following 5 images, focusing on manufacturing numbers between 1997-2007, including salaries and sales, are taken from a 2010 report by the UW-Milwaukee Center for Economic Development, titled The Economic State of Milwaukee, 1990-2008 (http://www4.uwm.edu/ced/publications/milwecon_2010.pdf). Also included is one table comparing manufacturing with other occupations:
>
>
>
>
The following 2 images are taken from a 2002 working paper from the UW-Milwaukee Center for Economic Development, titled The Economic Challenges Facing Milwaukee's Inner City, Statistical Snapshots (http://www4.uwm.edu/ced/snapshot/challenges_innercity.pdf):
 |
| (Compare with Table 9 from 2013 report shown above.) |
 |
| (Inner City not defined, but is likely a census tract demarcation. See 2013 report above for more info.) |
The following 7 images, comparing Milwaukee manufacturing with other Frostbelt cities, are taken from a 1998 report from the UW-Milwaukee Center for Economic Development, titled The Economic State of Milwaukee: The City and the Region (https://www4.uwm.edu/ced/publications/milwecon/about.cfm). Nothing new here; much of what's included has been incorporated into more recent data described above. Numbers are outdated, as latest year of data is 1992. It is interesting to note, however, that back then the growth in suburban manufacturing was seen as an overall positive for the region:
>
 |
| (See Table 6 from 2013 report above for current Milwaukee numbers) |
>
>
>
>


No comments:
Post a Comment